扫码一下
查看教程更方便
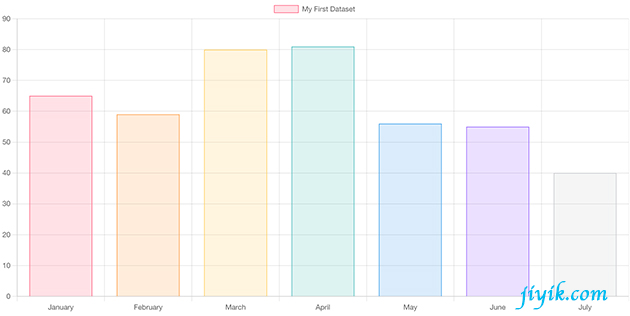
条形图提供了一种将数据值显示为垂直条的方式。 它有时用于显示趋势数据,以及并排比较多个数据集。
const labels = utils.months({count: 7});
const data = {
  labels: labels,
  datasets: [{
    label: 'my first dataset',
    data: [65, 59, 80, 81, 56, 55, 40],
    backgroundcolor: [
      'rgba(255, 99, 132, 0.2)',
      'rgba(255, 159, 64, 0.2)',
      'rgba(255, 205, 86, 0.2)',
      'rgba(75, 192, 192, 0.2)',
      'rgba(54, 162, 235, 0.2)',
      'rgba(153, 102, 255, 0.2)',
      'rgba(201, 203, 207, 0.2)'
    ],
    bordercolor: [
      'rgb(255, 99, 132)',
      'rgb(255, 159, 64)',
      'rgb(255, 205, 86)',
      'rgb(75, 192, 192)',
      'rgb(54, 162, 235)',
      'rgb(153, 102, 255)',
      'rgb(201, 203, 207)'
    ],
    borderwidth: 1
  }]
};
const config = {
  type: 'bar',
  data: data,
  options: {
    scales: {
      y: {
        beginatzero: true
      }
    }
  },
};
命名空间:
条形图允许为每个数据集指定许多属性。 这些用于设置特定数据集的显示属性。 例如,条形图的颜色一般都是这样设置的。 只需在数据集命名空间中指定数据选项。
| 名称 | 类型 | 可编写脚本 | 可索引 | 默认值 |
|---|---|---|---|---|
| backgroundcolor | color | yes | yes | 'rgba(0, 0, 0, 0.1)' |
| base | number | yes | yes | |
| barpercentage | number | - | - | 0.9 |
| barthickness | number | string | - | - |
| bordercolor | color | yes | yes | 'rgba(0, 0, 0, 0.1)' |
| borderskipped | string | yes | yes | 'start' |
| borderwidth | number | object | yes | yes |
| borderradius | number | object | yes | yes |
| categorypercentage | number | - | - | 0.8 |
| clip | number | object | - | - |
| data | object | object[] | number[] | string[] |
| grouped | boolean | - | - | true |
| hoverbackgroundcolor | color | yes | yes | |
| hoverbordercolor | color | yes | yes | |
| hoverborderwidth | number | yes | yes | 1 |
| hoverborderradius | number | yes | yes | 0 |
| indexaxis | string | - | - | 'x' |
| inflateamount | number | 'auto' | yes | yes |
| maxbarthickness | number | - | - | |
| minbarlength | number | - | - | |
| label | string | - | - | '' |
| order | number | - | - | 0 |
| pointstyle | pointstyle | yes | - | 'circle' |
| skipnull | boolean | - | - | |
| stack | string | - | - | 'bar' |
| xaxisid | string | - | - | 第一个 x 轴 |
| yaxisid | string | - | - | 第一个 y 轴 |
所有这些值,如果未定义,则回退到选项解析中描述的范围
data: {
    datasets: [{
        barpercentage: 0.5,
        barthickness: 6,
        maxbarthickness: 8,
        minbarlength: 2,
        data: [10, 20, 30, 40, 50, 60, 70]
    }]
};
| 名称 | 描述 |
|---|---|
| base | 沿值轴以数据单位表示的条形基值。 如果未设置,则默认为值轴基值。 |
| clip | 如何相对于 chartarea 进行剪辑。 正值允许溢出,负值在chartarea 内剪辑许多像素。 0 = 在图表区域剪辑。 剪裁也可以每边配置:clip:{left:5,top:false,right:-2,bottom:0} |
| grouped | 条形图是否应在索引轴上分组。 当为 true 时,具有相同索引值的所有数据集将以该索引值为中心彼此相邻放置。 当为 false 时,每根柱线都放置在其实际的索引轴值上。 |
| indexaxis | 数据集的基轴。 'x' 用于垂直条,'y' 用于水平条。 |
| label | 出现在图例和工具提示中的数据集标签。 |
| order | 数据集的绘制顺序。 还会影响堆叠、工具提示和图例的顺序。 更多的 |
| skipnull | 如果为 true,则在确定条形尺寸时将不会使用空值或未定义值进行间距计算。 |
| stack | 此数据集所属的组的 id(堆叠时,每个组将是一个单独的堆叠)。 |
| xaxisid | 绘制此数据集的 x 轴的 id。 |
| yaxisid | 绘制此数据集的 y 轴的 id。 |
| 名称 | 描述 |
|---|---|
| backgroundcolor | 条形图背景颜色。 |
| bordercolor | 条形图边框颜色。 |
| borderskipped | 绘制线条时要跳过的边缘。 |
| borderwidth | 条形边框宽度(以像素为单位)。 |
| borderradius | 条形边框半径(以像素为单位)。 |
| minbarlength | 设置此项以确保条具有最小长度(以像素为单位)。 |
| pointstyle | 图例点的样式。 |
所有这些值,如果未定义,则回退到关联的 elements.bar.* 选项。
此设置用于避免在填充底部绘制条形描边,或禁用边框半径。 通常,这不需要更改,除非创建从条形图派生的图表类型。
对于垂直图表中的负条,顶部和底部被翻转。 水平图表中的左侧和右侧也是如此。
如果此值是一个数字,它将应用于矩形的所有边(左、上、右、下),除了 borderskipped 。 如果此值是一个对象,则 left 属性定义左边框宽度。 同样,也可以指定 right、top 和 bottom 属性。 省略边框和borderskipped 被跳过。
如果此值是一个数字,它将应用于矩形的所有角(topleft、topright、bottomleft、bottomright),除了与 borderskipped 接触的角。 如果此值是一个对象,topleft 属性定义左上角边框半径。 同样,也可以指定 topright、bottomleft 和 bottomright 属性。 省略的角和那些触及边界的角被跳过。 例如,如果顶部边框被跳过,那么角 topleft 和 topright 的边框半径也将被跳过。
当边界半径以数字形式提供并且图表被堆叠时,半径将仅应用于位于堆栈边缘的条形或条形浮动的地方。 对象语法可用于覆盖此行为。
此选项可用于膨胀用于绘制条形的矩形。 这可用于在 barpercentage(#barpercentage) * categorypercentage(#categorypercentage) 为 1 时隐藏条形之间的伪影。默认值“auto”在大多数情况下应该有效。
可以使用以下属性控制与每个条的交互:
| 名称 | 描述 |
|---|---|
| hoverbackgroundcolor | 悬停时的栏背景颜色。 |
| hoverbordercolor | 悬停时的条形边框颜色。 |
| hoverborderwidth | 悬停时的条形边框宽度(以像素为单位)。 |
| hoverborderradius | 悬停时的条形边框半径(以像素为单位)。 |
所有这些值,如果未定义,则回退到关联的 elements.bar.* 选项。
每个条的可用宽度的百分比 (0-1) 应在类别宽度内。 1.0 将采用整个类别宽度并将条形放在彼此旁边。
每个类别的可用宽度的百分比 (0-1) 应在样本宽度内。
如果此值是一个数字,则将其应用于每个条的宽度,以像素为单位。 强制执行此操作时,barpercentage 和 categorypercentage 将被忽略。
如果设置为“flex”,则基本样本宽度会根据之前和之后的样本自动计算,以便它们采用完整的可用宽度而不会重叠。 然后,使用 barpercentage 和 categorypercentage 调整条形图的大小。 当百分比选项为 1 时没有间隙。当数据不均匀分布时,此模式会生成不同宽度的条形图。
如果未设置(默认),则使用防止条重叠的最小间隔计算基本样本宽度,并使用 barpercentage 和 categorypercentage 调整条的大小。 此模式始终生成大小相同的条形图。
设置此项以确保条的尺寸不会比这更厚。
条形图从关联的比例选项中为以下配置设置唯一的默认值:
| 名称 | 类型 | 默认值 | 描述 |
|---|---|---|---|
| offset | boolean | true | 如果为 true,则会在两条边上添加额外的空间,并缩放轴以适合图表区域。 |
| grid.offset | boolean | true | 如果为 true,则特定数据点的条形图位于网格线之间。 网格线将向左移动刻度间隔的一半。 如果为 false,则网格线将在条形中间向下。 |
options = {
    scales: {
        x: {
            grid: {
              offset: true
            }
        }
    }
};
如果为真,则特定数据点的条形图位于网格线之间。 网格线将向左移动刻度间隔的一半,即网格线之间的空间。 如果为 false,则网格线将在条形中间向下。 对于条形图中的类别比例,默认设置为 true,而对于其他比例或图表类型,默认设置为 false。
通常希望将配置设置应用于所有创建的条形图。 全局条形图设置存储在 chart.overrides.bar 中。 更改全局选项只会影响更改后创建的图表。 现有图表未更改。
下面显示了条形百分比选项和类别百分比选项之间的关系。
// categorypercentage: 1.0
// barpercentage: 1.0
bar:        | 1.0 | 1.0 |
category:   |    1.0    |
sample:     |===========|
// categorypercentage: 1.0
// barpercentage: 0.5
bar:          |.5|  |.5|
category:  |      1.0     |
sample:    |==============|
// categorypercentage: 0.5
// barpercentage: 1.0
bar:             |1.0||1.0|
category:        |   .5   |
sample:     |==================|
通过更改 x 和 y 轴上的设置以启用堆叠,可以将条形图配置为堆叠条形图。 堆积条形图可用于显示一个数据系列是如何由许多较小的部分组成的。
const stackedbar = new chart(ctx, {
    type: 'bar',
    data: data,
    options: {
        scales: {
            x: {
                stacked: true
            },
            y: {
                stacked: true
            }
        }
    }
});
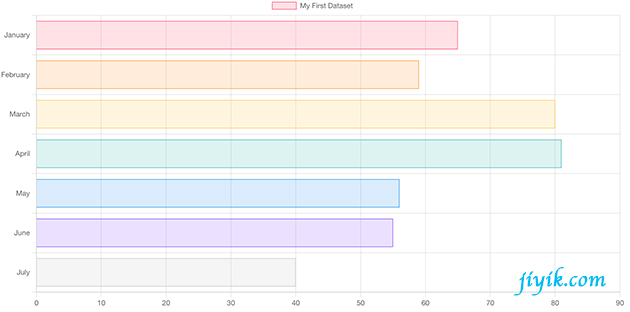
水平条形图是垂直条形图的变体。 它有时用于显示趋势数据,以及并排比较多个数据集。 为此,我们必须将选项对象中的 indexaxis 属性设置为“y”。 此属性的默认值为“x”,因此将显示垂直条。
const labels = utils.months({count: 7});
const data = {
  labels: labels,
  datasets: [{
    axis: 'y',
    label: 'my first dataset',
    data: [65, 59, 80, 81, 56, 55, 40],
    fill: false,
    backgroundcolor: [
      'rgba(255, 99, 132, 0.2)',
      'rgba(255, 159, 64, 0.2)',
      'rgba(255, 205, 86, 0.2)',
      'rgba(75, 192, 192, 0.2)',
      'rgba(54, 162, 235, 0.2)',
      'rgba(153, 102, 255, 0.2)',
      'rgba(201, 203, 207, 0.2)'
    ],
    bordercolor: [
      'rgb(255, 99, 132)',
      'rgb(255, 159, 64)',
      'rgb(255, 205, 86)',
      'rgb(75, 192, 192)',
      'rgb(54, 162, 235)',
      'rgb(153, 102, 255)',
      'rgb(201, 203, 207)'
    ],
    borderwidth: 1
  }]
};
const config = {
  type: 'bar',
  data,
  options: {
    indexaxis: 'y',
  }
};
水平条形图的配置选项与条形图相同。 但是,在条形图中 x 轴上指定的任何选项都将应用于水平条形图中的 y 轴。
{x, y, _custom} 中 _custom 是定义堆叠条形属性的可选对象:{start, end, barstart, barend, min, max} 。 start 和 end 是输入值。 这两个在 barstart(靠近原点)、barend(远离原点)、min 和 max 中重复。