扫码一下
查看教程更方便
旭日图(sunburst)由多层的环形图组成,在数据结构上,内圈是外圈的父节点。因此,它既能像饼图一样表现局部和整体的占比,又能像矩形树图一样表现层级关系。
echarts 创建旭日图很简单,只需要在 series 配置项中声明类型为 sunburst 即可,data 数据结构以树形结构声明,看下一个简单的实例:
var option = {
   title: {
                   text: "echarts 旭日图 - 迹忆客(jiyik.com)"
               },
    series: {
        type: 'sunburst',
        data: [{
            name: 'a',
            value: 10,
            children: [{
                value: 3,
                name: 'aa'
            }, {
                value: 5,
                name: 'ab'
            }]
        }, {
            name: 'b',
            children: [{
                name: 'ba',
                value: 4
            }, {
                name: 'bb',
                value: 2
            }]
        }, {
            name: 'c',
            value: 3
        }]
    }
};
效果图如下
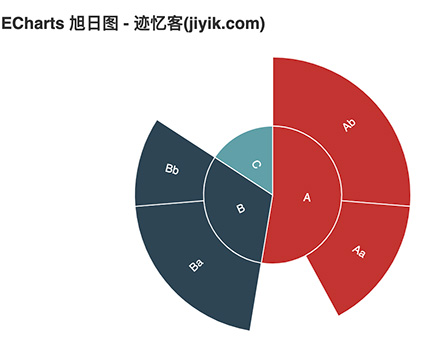
默认情况下会使用全局调色盘 color 分配最内层的颜色,其余层则与其父元素同色。
在旭日图中,扇形块的颜色有以下三种设置方式:
上述三者的优先级是从高到低的,也就是说,配置了 series.data.itemstyle 的扇形块将会覆盖 series.levels.itemstyle 和 series.itemstyle 的设置。
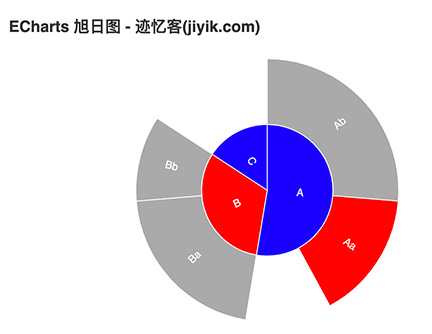
下面,我们将整体的颜色设为灰色 #aaa,将最内层的颜色设为蓝色 blue,将 aa、b 这两块设为红色 red。
var option = {
   title: {
                text: "echarts 旭日图 - 迹忆客(jiyik.com)"
        },
    series: {
        type: 'sunburst',
        data: [{
            name: 'a',
            value: 10,
            children: [{
                value: 3,
                name: 'aa',
                itemstyle: {
                    color: 'red'
                }
            }, {
                value: 5,
                name: 'ab'
            }]
        }, {
            name: 'b',
            children: [{
                name: 'ba',
                value: 4
            }, {
                name: 'bb',
                value: 2
            }],
            itemstyle: {
                color: 'red'
            }
        }, {
            name: 'c',
            value: 3
        }],
        itemstyle: {
            color: '#aaa'
        },
        levels: [{
            // 留给数据下钻的节点属性
        }, {
            itemstyle: {
                color: 'blue'
            }
        }]
    }
};
效果图如下
按层配置样式是一个很常用的功能,能够很大程度上提高配置的效率。
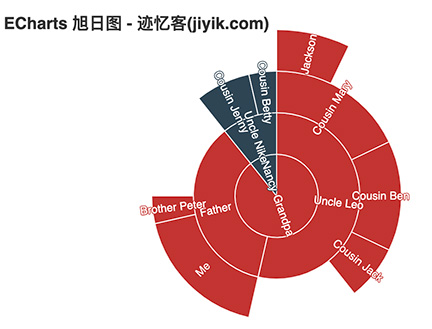
旭日图默认支持数据下钻,也就是说,当点击了扇形块之后,将以该扇形块的数据作为根节点,进一步显示该数据的细节。
在数据下钻后,图形的中间会出现一个用于返回上一层的图形,该图形的样式可以通过 levels[0] 配置。
var data = [{
    name: 'grandpa',
    children: [{
        name: 'uncle leo',
        value: 15,
        children: [{
            name: 'cousin jack',
            value: 2
        }, {
            name: 'cousin mary',
            value: 5,
            children: [{
                name: 'jackson',
                value: 2
            }]
        }, {
            name: 'cousin ben',
            value: 4
        }]
    }, {
        name: 'father',
        value: 10,
        children: [{
            name: 'me',
            value: 5
        }, {
            name: 'brother peter',
            value: 1
        }]
    }]
}, {
    name: 'nancy',
    children: [{
        name: 'uncle nike',
        children: [{
            name: 'cousin betty',
            value: 1
        }, {
            name: 'cousin jenny',
            value: 2
        }]
    }]
}];
option = {
    title: {
                text: "echarts 旭日图 - 迹忆客(jiyik.com)"
            },
    series: {
        type: 'sunburst',
        // highlightpolicy: 'ancestor',
        data: data,
        radius: [0, '90%'],
        label: {
            rotate: 'radial'
        }
    }
};
如果不需要数据下钻功能,可以通过将 nodeclick 设置为 false 来关闭,也可以设为 'link',并将 data.link 设为点击扇形块对应打开的链接。
旭日图支持鼠标移动到某扇形块时,高亮相关数据块的操作,可以通过设置 highlightpolicy,包括以下几种高亮方式:
上面提到的"高亮",对于鼠标所在的扇形块,会使用 emphasis 样式;对于其他相关扇形块,则会使用 highlight 样式。通过这种方式,可以很方便地实现突出显示相关数据的需求。
具体来说,对于配置项:
itemstyle: {
    color: 'yellow',
    borderwidth: 2,
    emphasis: {
        color: 'red'
    },
    highlight: {
        color: 'orange'
    },
    downplay: {
        color: '#ccc'
    }
}
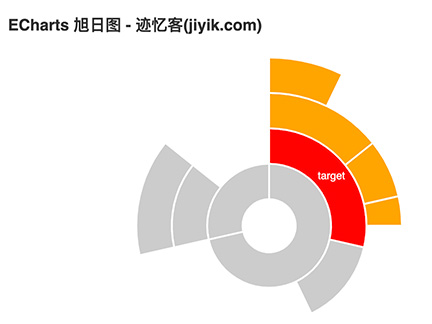
highlightpolicy 为 'descendant':
option = {
    silent: true,
    series: {
        radius: ['15%', '95%'],
        center: ['50%', '60%'],
        type: 'sunburst',
        sort: null,
        highlightpolicy: 'descendant',
        data: [{
            value: 10,
            children: [{
                name: 'target',
                value: 4,
                children: [{
                    value: 2,
                    children: [{
                        value: 1
                    }]
                }, {
                    value: 1
                }, {
                    value: 0.5
                }]
            }, {
                value: 2
            }]
        }, {
            value: 4,
            children: [{
                children: [{
                    value: 2
                }]
            }]
        }],
        label: {
            normal: {
                rotate: 'none',
                color: '#fff'
            }
        },
        levels: [],
        itemstyle: {
            color: 'yellow',
            borderwidth: 2
        },
        emphasis: {
            itemstyle: {
                color: 'red'
            }
        },
        highlight: {
            itemstyle: {
                color: 'orange'
            }
        },
        downplay: {
            itemstyle: {
                color: '#ccc'
            }
        }
    }
};
settimeout(function () {
    mychart.dispatchaction({
        type: 'sunbursthighlight',
        targetnodeid: 'target'
    });
});
效果图如下
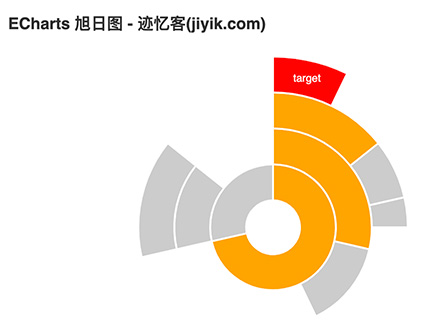
highlightpolicy 为 'ancestor' :
option = {
    silent: true,
    title: {
                text: "echarts 旭日图 - 迹忆客(jiyik.com)"
        },
    series: {
        radius: ['15%', '95%'],
        center: ['50%', '60%'],
        type: 'sunburst',
        sort: null,
        highlightpolicy: 'ancestor',
        data: [{
            value: 10,
            children: [{
                value: 4,
                children: [{
                    value: 2,
                    children: [{
                        name: 'target',
                        value: 1
                    }]
                }, {
                    value: 1
                }, {
                    value: 0.5
                }]
            }, {
                value: 2
            }]
        }, {
            value: 4,
            children: [{
                children: [{
                    value: 2
                }]
            }]
        }],
        label: {
            normal: {
                rotate: 'none',
                color: '#fff'
            }
        },
        levels: [],
        itemstyle: {
            color: 'yellow',
            borderwidth: 2
        },
        emphasis: {
            itemstyle: {
                color: 'red'
            }
        },
        highlight: {
            itemstyle: {
                color: 'orange'
            }
        },
        downplay: {
            itemstyle: {
                color: '#ccc'
            }
        }
    }
};
settimeout(function () {
    mychart.dispatchaction({
        type: 'sunbursthighlight',
        targetnodeid: 'target'
    });
});
效果图如下

更多旭日图配置参考: