在 r 中创建分组箱线图
本文将演示有关如何在 r 中创建分组箱线图的多种方法。
在 r 中使用 ggplot 函数中的 fill 参数创建分组箱线图
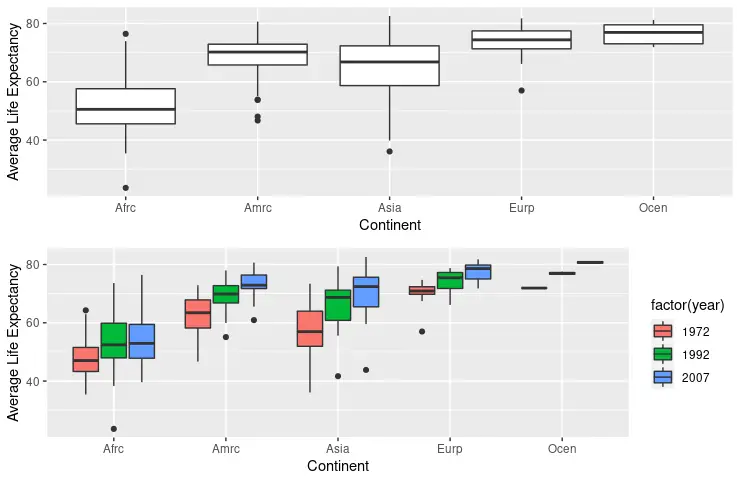
ggplot 函数和 geom_boxplot 通常用于构造箱线图对象。ggplot 函数的第一个参数表示要使用的数据集,而第二个参数指定美学映射列表。aes 函数将 x 和 y 参数映射到 gapminder 数据集中的 continent 和 lifeexp 列,在开始时使用 dplyr 包函数过滤。然后 fill 参数映射 year 列数据并绘制每个大陆的年度箱线图。在分配给 fill 参数之前,应将 year 数据转换为 factor;否则,绘制的图不影响分组。
library(ggplot2)
library(gridextra)
library(gapminder)
library(dplyr)
dat <- gapminder %>%
  filter(year %in% c(1972, 1992, 2007))
p1 <- ggplot(dat, aes(x = continent, y = lifeexp, fill = year))
  geom_boxplot()
  scale_y_continuous(name = "average life expectancy")
  scale_x_discrete(labels = abbreviate, name = "continent")
p2 <- ggplot(dat, aes(x = continent, y = lifeexp, fill = factor(year)))
  geom_boxplot()
  scale_y_continuous(name = "average life expectancy")
  scale_x_discrete(labels = abbreviate, name = "continent")
grid.arrange(p1, p2, nrow = 2)
在 r 中使用 facet_wrap 函数构建分组箱线图
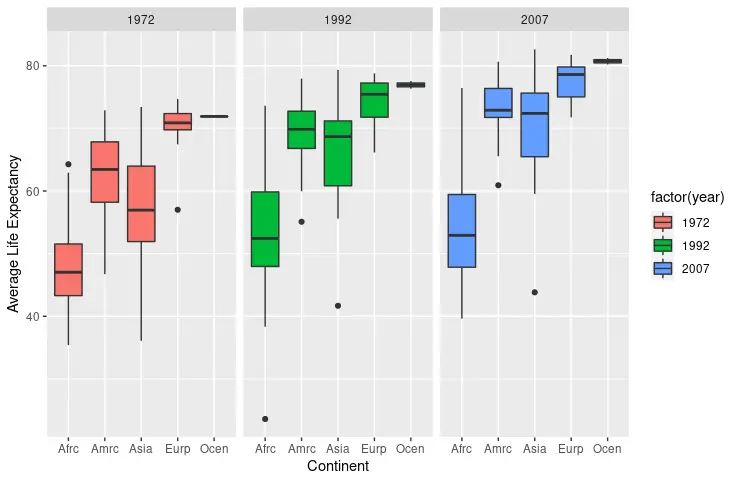
facet_wrap 函数是绘制按特定参数分组的多个箱线图的另一种选择。在这种情况下,我们展示了图的年度分组。请注意,facet_wrap 可以在不指定 fill 参数的情况下工作,但它有助于通过使用以下代码片段输出的颜色区分不同的图。scale_x_discrete 和 scale_y_continuous 也用于修改标签和轴名称。
library(ggplot2)
library(gridextra)
library(gapminder)
library(dplyr)
dat <- gapminder %>%
  filter(year %in% c(1972, 1992, 2007))
p3 <- ggplot(dat, aes(x = continent, y = lifeexp, fill = factor(year)))
  geom_boxplot()
  facet_wrap(~year)
  scale_y_continuous(name = "average life expectancy")
  scale_x_discrete(labels = abbreviate, name = "continent")
p3
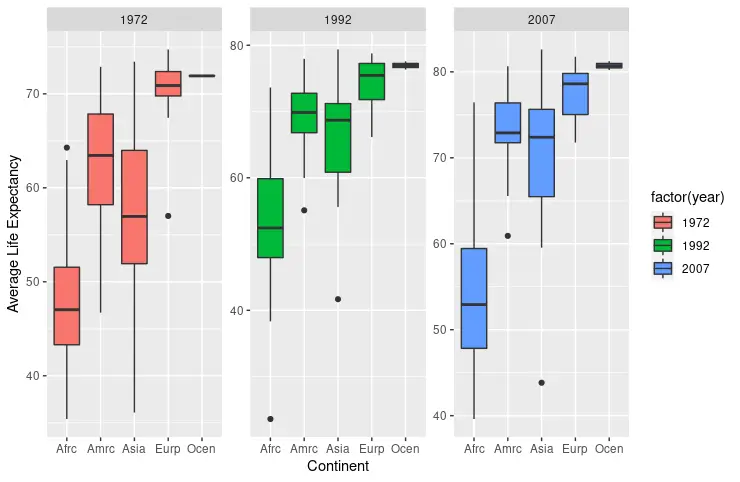
facet_wrap 在不同的图中显示相同的比例。尽管我们可以将 free 字符串分配给 scale 参数,这会导致自动调整比例。
library(ggplot2)
library(gridextra)
library(gapminder)
library(dplyr)
dat <- gapminder %>%
  filter(year %in% c(1972, 1992, 2007))
p4 <- ggplot(dat, aes(x = continent, y = lifeexp, fill = factor(year)))
  geom_boxplot()
  facet_wrap(~year, scale = "free")
  scale_y_continuous(name = "average life expectancy")
  scale_x_discrete(labels = abbreviate, name = "continent")
p4
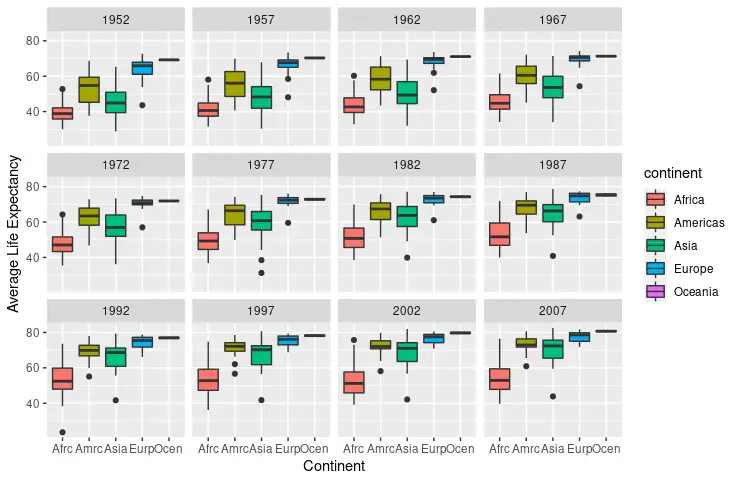
还可以从未过滤的 gapminder 数据集构建年度箱线图。这一次,fill 参数映射了 continent 列,而 facet_wrap 函数再次获取 year 数据。
library(ggplot2)
library(gridextra)
library(gapminder)
library(dplyr)
p5 <- ggplot(gapminder, aes(x = continent, y = lifeexp, fill = continent))
  facet_wrap(~year)
  geom_boxplot()
  scale_y_continuous(name = "average life expectancy")
  scale_x_discrete(labels = abbreviate, name = "continent")
p5
转载请发邮件至 1244347461@qq.com 进行申请,经作者同意之后,转载请以链接形式注明出处
本文地址:
相关文章
发布时间:2024/02/05 浏览次数:207 分类:编程语言
-
本文介绍了如何交互式清除 r 控制台。
发布时间:2024/02/05 浏览次数:160 分类:编程语言
-
本文介绍如何用键盘或鼠标停止运行r代码。
发布时间:2024/02/05 浏览次数:223 分类:编程语言
-
本教程演示了如何设置 r 便携版。
发布时间:2023/03/21 浏览次数:72 分类:编程语言
-
一项常见的数据分析任务是根据同一行的其他列使用一个或多个条件创建或更新数据框列。 如果我们尝试使用 if 语句来执行此操作,则只会使用第一行来测试条件,并且会根据该行更
发布时间:2023/03/21 浏览次数:198 分类:编程语言
-
在这篇文章中,你将会了解到两个在 r 中读取 xlsx 文件的最完整和最容易使用的库:readxl 和 openxlsx。
发布时间:2023/03/21 浏览次数:371 分类:编程语言
-
在本教程中,你将学习如何在 r 中编写一个函数,在不需要重新启动 r 的情况下清除环境。
发布时间:2023/03/21 浏览次数:164 分类:编程语言
-
本教程演示了如何检查 r 的版本。
发布时间:2023/03/21 浏览次数:222 分类:编程语言
-
本教程演示了如何在 r 中创建一个空向量。
发布时间:2023/03/21 浏览次数:176 分类:编程语言
-
本教程演示了如何在 r 向量中查找元素的索引。