base r 中的色盲无障碍颜色
现在众所周知,与颜色相关的视力缺陷很常见。因此,我们需要在数据可视化中使用色盲可以接受的颜色。
本文展示了如何为此目的使用 base r 的内置调色板。
base r 中的 okabe-ito 调色板
base r 带有几个内置的调色板。可以使用命令 palette.pals() 查看调色板列表。
默认调色板是 r4。
内置调色板列表包括 okabe-ito 调色板。这已被确立为与颜色相关的视觉缺陷的合适调色板。
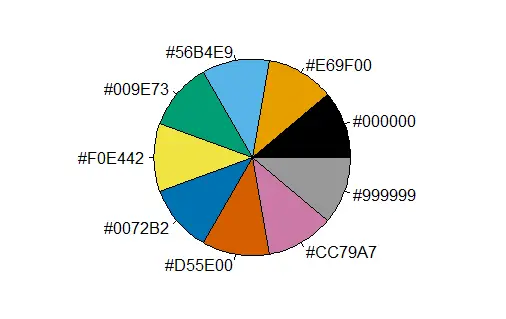
okabe-ito 调色板有九种颜色。我们可以使用 palette.colors() 函数查看颜色的名称。我们可以使用饼图可视化颜色。
示例代码:
# list the inbuilt color palettes.
palette.pals()
# list the colors in the okabe-ito palette.
palette.colors(null, "okabe-ito")
# save the palette as a vector.
p = palette.colors(null, "okabe-ito")
# visualize the colors.
# the order is anticlockwise, starting with black.
pie(rep(1, times=9), col=p, labels=p)
输出:
> # list the inbuilt color palettes.
> palette.pals()
 [1] "r3"              "r4"              "ggplot2"         "okabe-ito"
 [5] "accent"          "dark 2"          "paired"          "pastel 1"
 [9] "pastel 2"        "set 1"           "set 2"           "set 3"
[13] "tableau 10"      "classic tableau" "polychrome 36"   "alphabet"
> # list the colors in the okabe-ito palette.
> palette.colors(null, "okabe-ito")
        black        orange       skyblue   bluishgreen        yellow          blue
    "#000000"     "#e69f00"     "#56b4e9"     "#009e73"     "#f0e442"     "#0072b2"
   vermillion reddishpurple          gray
    "#d55e00"     "#cc79a7"     "#999999"
在 base r 中使用 okabe-ito 调色板的三种方法
使用 okabe-ito(或任何其他)调色板有三种方法。
-
使用
palette()函数更改 r 会话的调色板。 - 直接使用颜色而不改变会话调色板。
- 创建一个新调色板。我们可以使用现有调色板或多个调色板中的颜色,或任何其他颜色。
首先,我们将为 r 会话设置调色板。
示例代码:
# set the okabe-ito palette for the session.
palette("okabe-ito")
# get the palette colors.
palette() # we do not get the names.
# see the colors with the names.
palette.colors(null, "okabe-ito")
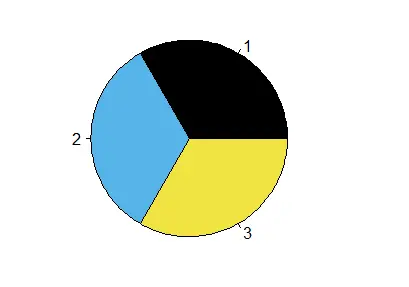
# use its colors by index position.
# make a pie chart with 3 sections using colors at positions 1, 3, 5.
pie(c(1,1,1), col=c(1,3,5))
输出:
其次,我们将直接使用 okabe-ito 调色板。
示例代码:
# reset the palette to the default, r4.
palette("default")
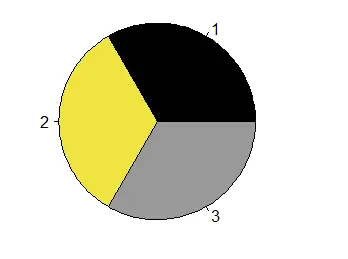
# we earlier saved the okabe-ito palette to a variable p.
p
# make a pie chart using colors 1, 5 and 9 from this vector p.
pie(c(1,1,1), col=p[c(1,5,9)])
输出:
第三,我们将从 okabe-ito 调色板创建我们的调色板。这一次,我们将使用颜色代码。
我们可以使用这种技术从任何调色板或我们想要的任何其他颜色中选择颜色。
示例代码:
# view the okabe-ito palette.
p
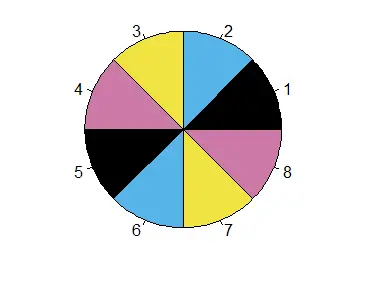
# create a character vector of four color codes.
ch = c("#000000", "#56b4e9", "#f0e442", "#cc79a7")
# we can use the colors from our vector by position.
# or we can set our vector of color codes as the palette for the session.
pie(c(1,1,1), col=ch[1:3]) # use by position.
palette(ch) # set the palette.
palette() # view the palette.
pie(c(1,1,1,1,1,1,1,1),col=palette()) # the colors are repeated in order.
输出:
转载请发邮件至 1244347461@qq.com 进行申请,经作者同意之后,转载请以链接形式注明出处
本文地址:
相关文章
发布时间:2024/02/05 浏览次数:207 分类:编程语言
-
本文介绍了如何交互式清除 r 控制台。
发布时间:2024/02/05 浏览次数:160 分类:编程语言
-
本文介绍如何用键盘或鼠标停止运行r代码。
发布时间:2024/02/05 浏览次数:223 分类:编程语言
-
本教程演示了如何设置 r 便携版。
发布时间:2023/03/21 浏览次数:72 分类:编程语言
-
一项常见的数据分析任务是根据同一行的其他列使用一个或多个条件创建或更新数据框列。 如果我们尝试使用 if 语句来执行此操作,则只会使用第一行来测试条件,并且会根据该行更
发布时间:2023/03/21 浏览次数:198 分类:编程语言
-
在这篇文章中,你将会了解到两个在 r 中读取 xlsx 文件的最完整和最容易使用的库:readxl 和 openxlsx。
发布时间:2023/03/21 浏览次数:371 分类:编程语言
-
在本教程中,你将学习如何在 r 中编写一个函数,在不需要重新启动 r 的情况下清除环境。
发布时间:2023/03/21 浏览次数:164 分类:编程语言
-
本教程演示了如何检查 r 的版本。
发布时间:2023/03/21 浏览次数:222 分类:编程语言
-
本教程演示了如何在 r 中创建一个空向量。
发布时间:2023/03/21 浏览次数:176 分类:编程语言
-
本教程演示了如何在 r 向量中查找元素的索引。